


Business and Economic Development
Dún Laoghaire Footfall
Dún Laoghaire-Rathdown County Council installed state-of-the-art technology at three locations along George’s St, Dún Laoghaire in May 2021. The technology analyses road user movements on a continuous 24/7/365 basis and provides highly accurate, robust data on footfall flows and movement patterns. Three new sensors were installed in December 2022, these are the same state-of-the-art technology sensors that were installed previously in Georges street. The counters are located at:
- George’s St Upper
- Marine Road junction
- George’s St Lower
- Georges St Lower, at Brock's Ln
- Blackrock Main St
- Dundrum Main St
The sensors are able to automatically recognise and provide data for different road user classifications including: pedestrian movements, cyclists, cars, motorbikes, vans, lorries, HGVs and buses. No images or personal data, including mobile phone data, is captured or stored in the process.
Footfall information for Dún Laoghaire is available on our interactive Footfall Dashboard*, similar interactive Footfall Dashboards will be available soon for both Dundrum and Blackrock.
*Please note that Sensor 2 at Marine Road Junction was down from 1/12/2021 to 4/5/2022
and again From 17/6/2022 to 13/7/2022 due to technical fault. Graphs/charts on the dashboard reflect that gap in data.
For a quick update on footfall performance, you can scroll down to see previous months Footfall analysis of pedestrian data for Upper and Lower George’s St below.
For any questions or inquiries, you con contact us at economicdev@dlrcoco.ie.
Key figures (total of all 4 George’s St locations)
- Highest recorded pedestrian movements in a day to date reached 74,165 on Friday 22/12/2023
- Average number of daily pedestrian movements is 23,435
- Highest number of pedestrian movements recorded in a week was on week commencing 29/05/2023 with a total of 218,888
- Average number of weekly pedestrian movements is 199,520
- Usual daily peak time is from 12:00 to 01:00 pm
December Footfall analysis*:
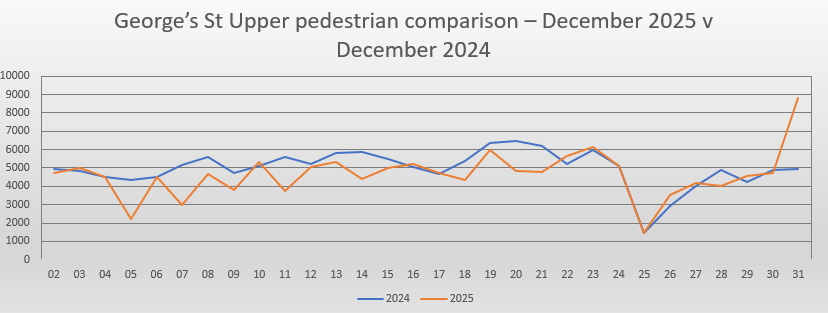
Below are the Lower and Upper George’s street comparisons between December 2025 and December 2024.
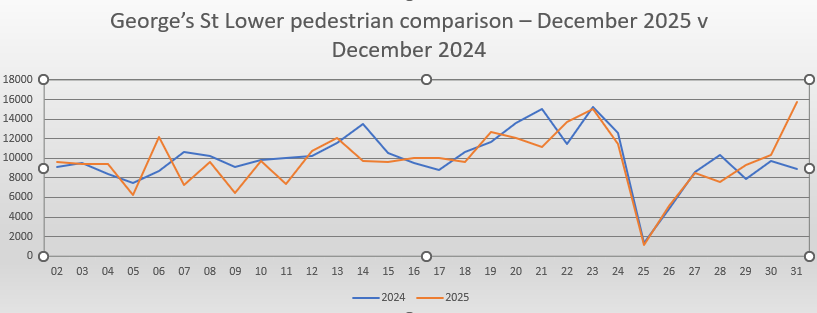
December 2025 started the month with Storm Bram which gave a wet start followed by a mild mid and cold and dry finish to the month. This seemed to effect footfall which decreased by 5% compared to last year
For Upper George's Street, footfall for December 2025 saw a decrease of 8% in footfall from 2024.
Overall footfall in December 2025 decreased by 5%.
Footfall analysis is done on the sensors at both ends of Georges street. Footfall Sensors at Marine Rd and Georges St Lower (at Brock's Ln) will be included in the analysis after 12 months of uninterrupted footfall dataset.